Inverted Yield Curve and Economic Recession – Why does it matter now ?
- Mangesh
- Sep 12, 2019
- 7 min read
Updated: Sep 25, 2019

Contents
Trading of Government Bonds
Bond: Price vs. Yield
How interest rates affect bond price
What is yield curve?
What does yield curve inversion signifies?
Why does yield curve inverts?
Current yield curve inversion
Inverted Yield curve and Recessions
There is historical pattern of Yield curve reversal before every major economic recession since 1950, Suggesting major economic downturn is coming
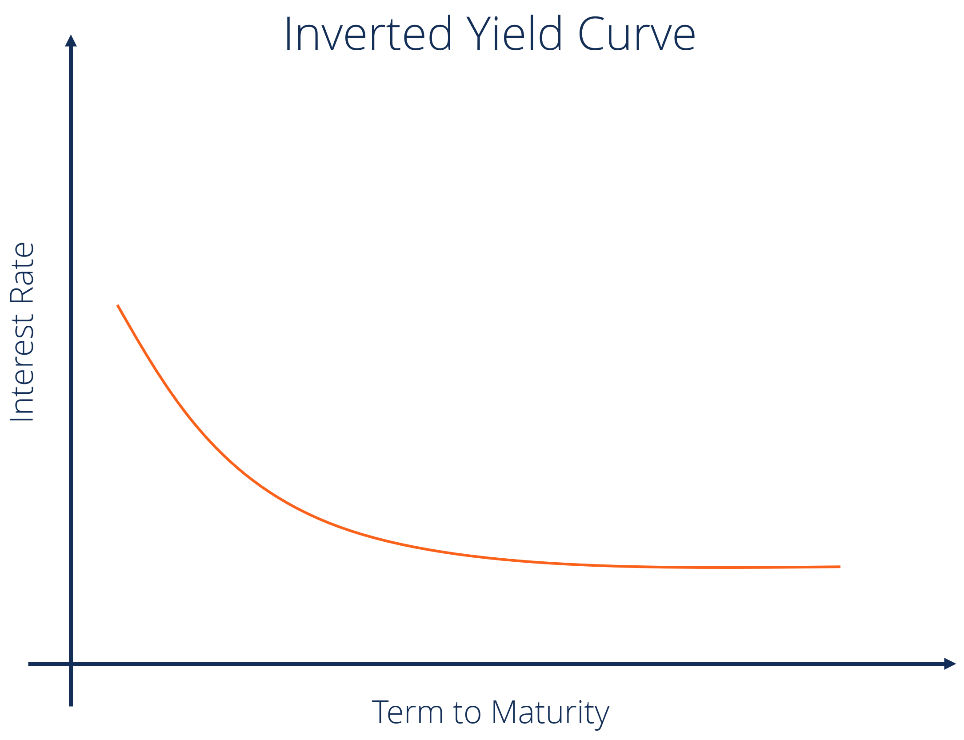
Currently Investors and Economists all over the world are spooked by the Scenario called as Inverted Yield Curve a phenomenon where Interest or Yield on short term bonds is higher than for Long term bonds
To understand bond yield and how yield reversal can happen first it is necessary to understand how bonds really work
Government bond is a debt investment, where investors lend money to government for some agreed rate of return called as yield of the particular bond. Government can spend that money on new projects like roads, schools, hospitals or for other infrastructure development and returns the agreed interest rate on bond to the investors. Bond basically signifies the contract between Investor and Government
Each bond is issued for a specific time frame called as Maturity after which you get back your original investment along with Agreed rate of return. You can buy bonds that mature in few months as well as bonds which will mature after 30 years
1. Trading of Government Bonds
Just like stocks, Bonds can also be Bought and sold in “Secondary Market” once they stand issued. Some bonds are traded publicly via Exchanges, whereas most of the bonds are traded via OTC’s (Over the Counter). An over the counter security is traded through a dealer network rather than through a centralized, formal exchange and trading happens between large broker-Dealer acting on their or their clients behalf.
If you buy and hold bond till maturity changes in Interest rate, changes in its price or yield will have no effect on your returns. But, most of investors buy and sell bonds from secondary markets (it gives investors freedom to buy and sell bonds at any time without holding them till maturity). Bond is always issued at certain face value and with certain coupon rate or Interest rate. But, as they are traded continuously in market their prices can change based on willingness of investors to buy them. That is actual price will be what investors are willing to pay for that bond. Willingness depends on different factors such as Current Economic condition, Interest rates etc. This change in price will lead to change in yield of the particular bond. How bond price gets affected in secondary market will be discussed in further sections.
2. Bond: Price vs. Yield
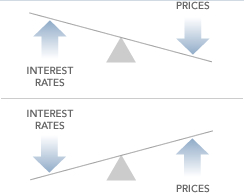
Bond price always moves in opposite direction as that of yield. Let us understand this concept with a following example.
Current yield is calculated based on current price of bond whereas Interest received will depend on face value of the bond,

Suppose US Treasury issues a bond with Face value of Rs. 1000 with Interest rate of 5 %. So this bond will give returns of Rs. 50 every year.
Now, suppose more investors are willing to but this bond in the market which will lead to rise in price of the bond, Price increases to Rs. 1100 now, for the same bond yield will be Rs. 50 for price of Rs. 1100 i.e. Yield percentage will be 50/1100*100 = 4.5%. Due to increase in demand of bond, price has increased and Yield has decreased from 5% to 4.5%
Now, suppose investors are less willing to buy this bond and price decreases to Rs 900. Now Yield percentage will be 50/900*100 = 5.55%. Decrease in demand lead to higher bond yield.
‘ Yield and Price of the bond share an inverse relationship. As price increases yield will decrease and as price decreases yield will increase ‘
3. How interest rates affect bond price
The price of the bond can be affected significantly based on interest rates. In simple words if Interest rates rises then people will be more willing to invest in Fixed deposit than in bonds as FD is offering more interest rate, This will lead to lesser bond demand are prices will fall and vice versa. Also new bonds are likely to be issued with higher rate making previously issued bonds less attractive.

4. What is yield curve?
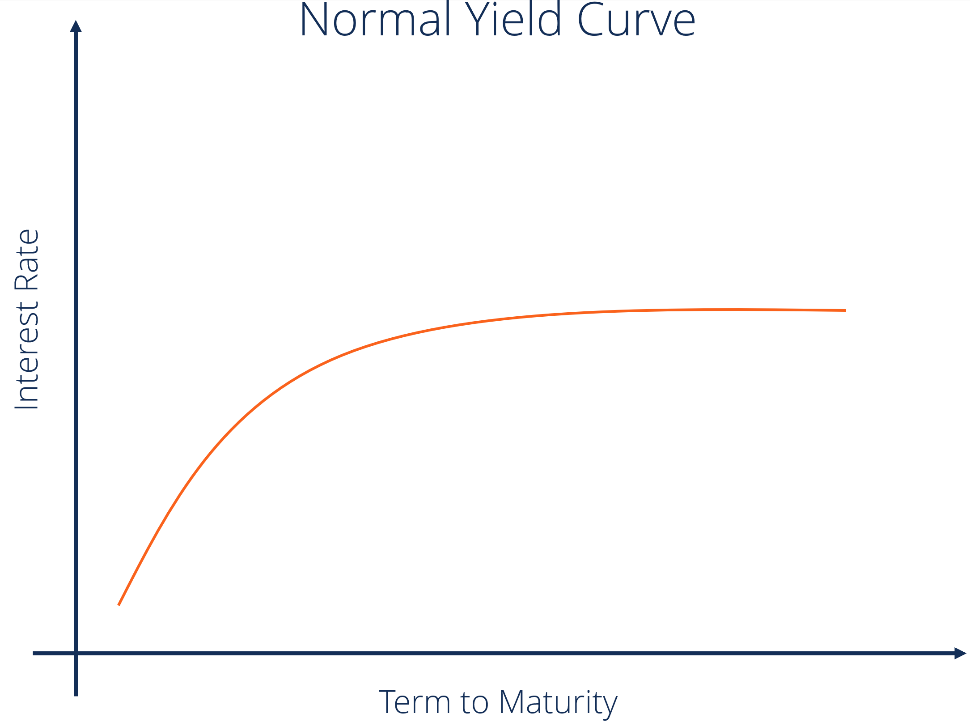
Yield curve is graphical representation of Yield offered by bond for different maturity periods. On Y axis Yield offered on a security will be plotted against Time of maturity on X axis.

A yield curve is generally upward sloping, as the time of maturity increases the associated interest rate will also increase. The reason behind is that, longer you commit to a fund more you should be rewarded. There will be greater number of economic uncertainties in longer term as compared to short term. Debt issued for a longer term carries greater risk because of greater likelihood of inflation or default in the long run. Therefore, investors (debt holders) usually require a higher rate of return (a higher interest rate) for longer-term debt.
5. What does yield curve inversion signifies ?
When a Yield curve inverts it signifies that investors have less confidence on the near future of the economy. They perceive near term future as riskier than the distant future. They demand more yield for short term investment than for long term investment.
Let’s understand inversion phenomenon in more details.

The U.S. treasury department sells treasury bills, bonds and notes in 12 different maturity periods
One month, Two month, Three month and Six month bills
One year, two year, three year, five year, and 10 Year Treasury Notes
30-year bonds
During healthy economy long term bond yield will be always higher than the short term bond yield.
But if economy is not performing well investors might want to park their money in long term bonds than short term bonds. Investors know that Federal Reserve or central bank will lower the interest rate to increase spending and boost the economy. Short term treasury bills usually track the fed fund rates and as interest rate decreases bond price will increase and will lead to lower yield in near future. Investors know that with a short-term bill, they have to reinvest that money in a few months and as investors have already predicted higher bond price and lower yield in short term they will be less willing to buy short term bonds.
Suppose investor A buys short term bonds of say 3 months, then in few months after maturity he will again have to invest that money to buy bonds, but till that time Federal Reserve has decreased interest rate so bonds bought again will offer lower yield
Investors B suppose buys long term bond of say 10 years then he has avoided this situation as he can sell the bond once the recession is over and fed rates normalize again.
So, Investor B is in better condition than Investor A
6. Why does yield curve inverts ?
So investors will flock to buy long term treasury bonds, their demand increases and their yield will fall, at the same time demand for short term treasury bills fall and hence their yield will increase. Eventually, the yield on short-term Treasury’s rises higher than the yield on long-term bonds and the yield curve inverts.
Recessions last 18 months on average. If investors believe a recession is imminent, they'll want a safe investment for two years. They'll avoid any Treasury’s with maturities of less than two years. That sends the demand for those bills down, sending their yields up, and inverting the curve.
7. Current yield curve inversion
' On December 3, 2018, the Treasury Yield Curve inverted for the first time since the recession '
The yield on the five-year note was 2.83. That's slightly lower than the yield of 2.84 on the three-year note. In this case, you want to look at the spread between the 3-year and 5-year notes. It was -0.01 points.

Investors are saying that the economy will be a bit better in five years than in three years
On March 22, 2019, the Treasury yield curve inverted more. The yield on the 10-year note fell to 2.44. That's 0.02 points below the three-month bill
On August 12, 2019, the 10-year yield hit a three year low of 1.65%. That was below the 1-year note yield of 1.75%. On August 14, the 10 year yield briefly fell below that of the 2-year note. On August 15, the yield on the 30-year bond closed below 2% for the first time ever.

The Federal Reserve Bank of Cleveland found that the spread between these two indicators is one of the best indicators of future recessions. It has reliably predicted a recession would occur about a year out.
8. Inverted Yield curve and Global Recessions
In April 2009, IMF defined Global recession:
‘A decline in annual per‑capita real World GDP (purchasing power parity weighted), backed up by a decline or worsening for one or more of the seven other global macroeconomic indicators: Industrial production, trade, capital flows, oil consumption, unemployment rate, per‑capita investment, and per‑capita consumption’
By this new definition, a total of four global recessions took place since World War II: 1975, 1982, 1991 and 2008. All of them only lasted one year.
There were one more instances when global annual real GDP growth fell below 3% which is considered as leading indicator of Global Recession in 2001
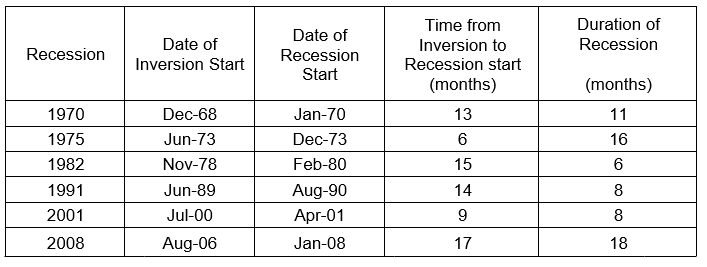
All the recessions since 1970 (up through 2018) have been preceded by an inverted yield curve (10-year vs. 3-month).
Yield curve inversion happened before every recession of 1970, 1975, 1982, 1991, 2001 and 2008.


‘The yield curve predicted the 2008 financial crisis two years earlier’
The first inversion occurred on December 22, 2005. The Fed, worried about an asset bubble in the housing market, had been raising the fed funds rate since June 2004. By December, it was 4.25 percent.
That pushed the yield on the two-year Treasury bill to 4.41 percent. But the yield on the 10-year Treasury note didn't rise as fast, hitting only 4.39 percent. That meant investors were willing to accept a lower return for lending their money for 10 years than for two years.
On July 17, 2006, the inversion worsened again when the 10-year note yielded 5.07 percent, less than the two-year note of 5.12 percent. This showed that investors thought the Fed was headed in the wrong direction. It was warning of the impending subprime mortgage crisis.
‘The yield curve became inverted in the first half of 2019, for the first time since 2007’
A yield curve inversion is among the most consistent economic indicators. Even if inversion is followed by recession, the slowdown might not happen immediately. Historically yields have reversed on average 12 months before the economic slowdown.

Comments